Principal Component Analysis on Meat Products
This project will explore the potential correlations of mineral nutrients contents in meat products, using the food nutrient information dataset from United States Department of Agriculture (USDA) (USDA, 2019). This includes beef products, finfish and shellfish products, Pork Products, Lamb, Veal, and Game Products and poultry products. The dataset includes the description and nutrients contents for 8,618 food products, categorized into different food groups. Other than the absolute value of nutrients, the dataset also includes the nutrients’ percentage of the United States Recommended Daily Allowance (USRDA), which will not be included in this analysis.
raw_df_2 <- read_csv("usda_nutrients.csv")raw_df_meat <- raw_df_2 %>%
filter (FoodGroup %in% c("Finfish and Shellfish Products", "Poultry Products","Pork Products", "Lamb, Veal, and Game Products", "Beef Products")) %>% # Selecting all meat products in the dataset
clean_names() %>%
select(food_group,calcium_mg, copper_mcg, iron_mg, magnesium_mg, manganese_mg, phosphorus_mg, selenium_mcg, zinc_mg) # Selecting all mineral nutrients in the dataset# Selecting the numerical part of the dataset for PCA analysis
pca_df <- raw_df_meat[c(2:9)]
meat_pca <- prcomp(pca_df, scale = TRUE)
# Un-comment this if you need see the result of PCA
# summary(meat_pca)#Finishing biplot
my_biplot <- autoplot(meat_pca,
data = raw_df_meat,
colour = 'food_group',
alpha = 0.5,
size = 0.5,
loadings.colour = "#00A08A",
loadings.label = TRUE,
loadings.label.size = 3,
loadings.label.colour = "black",
loadings.label.repel = TRUE) +
theme_minimal()+
scale_color_manual(values=wes_palette(n=5, name="FantasticFox1"))+
labs(color = "Food Group")+
xlab("Principal Component 1 (25.62%)")+
ylab("Principal Component 2 (17.27%)")
my_biplot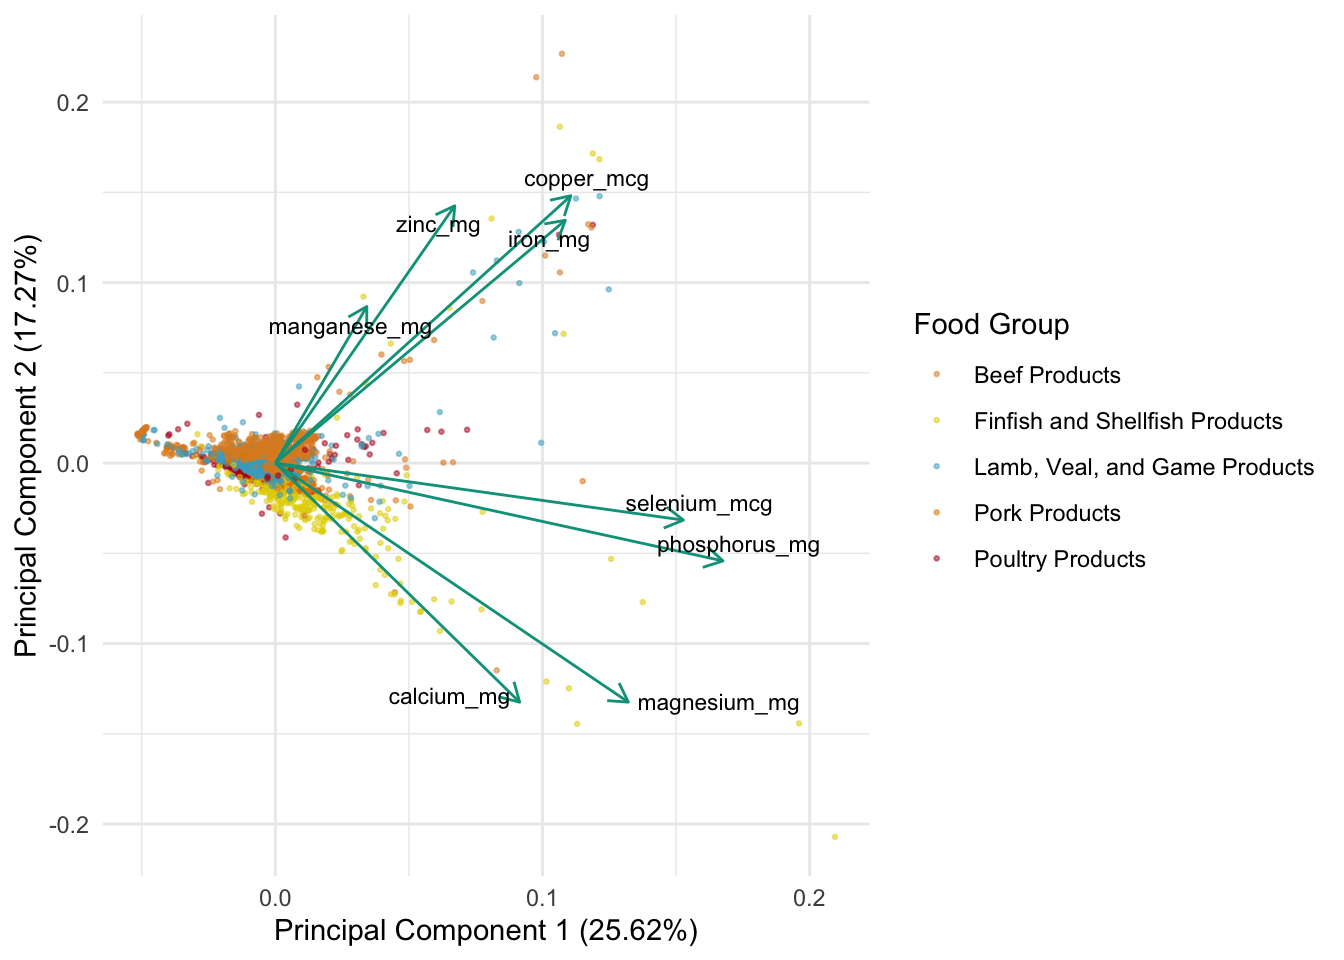
Figure 1. Principal Component Analysis Biplot Showing Mineral Nutrients Contents Associations in Meat Products. Principal component 1 and principal component 2 together can expalin 42.89% of the data variance. Color of the points indicates the type of the meat (Source: USDA, 2019).
Take-aways from the biplot:
- In meat products, mineral nutrients usually have a positive correlation with each other. This means that when a product is rich in one mineral nutrient, it is usually rich in other nutirents too. However, this correlation can be stronger for some nutrients, while neglegible for others.
- Four pairs of mineral nutrients–calcium/magnesium, phosphorus/selenium, iron/copper, and zinc/manganese–have strong correlations within each pair. For example, if a product is rich in calcium, it is predicted that it is also rich in magnesium.
- On top of the four pairs, the mineral nutrients can also be separated into two groups–one with calcium, magnesium, phosphorus, and selenium, while the other one with iron, copper, zinc, and manganese. The nutrients within each group have relatively strong correlation with each other.
- The correlation between calcium and zinc/manganese is very weak, meaning that the richness of calcium is predicted to not affect the richness of zinc or manganese.
- Products from the same food group are usually clustered together, meaning that meat of the same type usually have similar nutrients content with each other.
Reference:
- USDA. (2019). Food nutrient information for raw fruits and veggies from USDA (National Nutrient Database. Available at: https://fdc.nal.usda.gov/index.html
Yingfei "Ted" Jiang
Sustainability Specialist
客亦知夫水與月乎?逝者如斯,而未嘗往也;盈虛者如彼,而卒莫消長也。蓋將自其變者而觀之,則天地曾不能以一瞬;自其不變者而觀之,則物與我皆無盡也,而又何羨乎? 且夫天地之間,物各有主,茍非吾之所有,雖一毫而莫取。惟江上之清風,與山間之明月,耳得之而為聲,目遇之而成色,取之無禁,用之不竭,是造物者之無盡藏也,而吾與子之所共食。 –蘇軾《赤壁賦》
Do you happen to know the nature of water or the moon? Water is always on the run like this, but never lost in its course; the moon always waxes and wanes like that, but never out of its sphere. When viewed from a changing perspective, the universe can hardly be the same even within a blink of an eye, But when looked at from an unchanging perspective, everything conserves itself, and so do we. Therefore, what’s in them to be admired? Besides, in this universe, everything has its rightful owner. If something does not belong to you, then you shall not even have a bit of it. Only the refreshing breeze on the river and the bright moon over the hills are an exception. If you can hear it, it is a sound to you; if you can see it, it is a view to you. It never ends and is never exhausted. It is the infinite treasure granted to us by our Creator for both of us to enjoy. – Su Shi, Ode to the Red Cliff